Are Breweries Profitable? Where the Margin Actually Comes From

Share the page:
TL;DR
The median craft brewery runs a 35% gross margin on beer production and a 14% operating margin, on Brewers Association benchmarking of 2025 data. Those are real numbers and they are also close to useless on their own, because the same beer earns a completely different margin depending on how it leaves the building. Published benchmarks put taproom gross margin near 75%, draft into accounts near 60%, and packaged beer into distribution near 40%. Profitability is a channel question before it is a business question, and that is what should decide where the marketing money goes. This guide is for brewery operators deciding whether the numbers justify the next move.
Introduction: The Honest Answer Is a Range, and the Range Is the Point
Ask whether breweries are profitable and you get a number. Usually one number, usually quoted without saying which kind of brewery, which year, or which half of the business it describes. The number is not wrong. It is just not an answer you can do anything with.
The question comes up in most BeerSoft discovery calls, generally about ten minutes in, and the honest first response is another question: profitable selling what, to whom, and through which door? Operators almost always have the answer to that already. They just have not been asked to connect it to the margin figure they have been carrying around.
The useful version takes one more step. A brewery is not one business with one margin. It is a production operation that sells through several channels at wildly different rates of return, and the blend of those channels does more to decide whether the year works than almost anything happening in the brewhouse. Two breweries making identical beer at identical cost can land either side of break-even on channel mix alone.
That is the part worth understanding before you decide anything about pricing, distribution or marketing spend. The industry average tells you where you sit. The channel spread tells you what to do about it.
So Are Breweries Profitable, or Not?
On the median, modestly. The Brewers Association's financial benchmarking of 2025 data puts the median gross profit margin on beer production at 35% and the median operating profit margin at 14%. A 14% operating margin is a real business. It is not a comfortable one, and it means roughly one dollar in seven of revenue survives to cover debt service, tax and the owner.
The backdrop matters for reading those figures. As of June 2026 there were 9,344 operating US breweries, down from 9,515 a year earlier, a net loss of 171 breweries or 1.8%. Craft volume fell about 4% across the first half of 2026 against the same period in 2025. The decline is not evenly spread: microbreweries and regional breweries both contracted around 3%, taprooms about 2%, and brewpubs about 1%.
That ordering is the first hint at the channel argument. The models most dependent on getting beer out through distribution shrank fastest. The models that sell most of their beer to someone standing in their own building shrank slowest.
It helps to convert the operating figure into cash, because percentages flatter small businesses. On a brewery turning over a million dollars, a 14% operating margin is $140,000 before debt service, before tax and before the owner is paid anything. If there is a loan against the brewhouse, a good share of that is committed before it arrives. This is why operators describe years that look acceptable on a margin report as years when nothing was left over. Both things were true: the margin was real, and the cash it produced was already spoken for.
Key Takeaway: Treat 35% gross and 14% operating as the industry midpoint rather than a target. Where you sit against it is decided mostly by the next section.
Why Does the Same Beer Earn Two Different Margins?
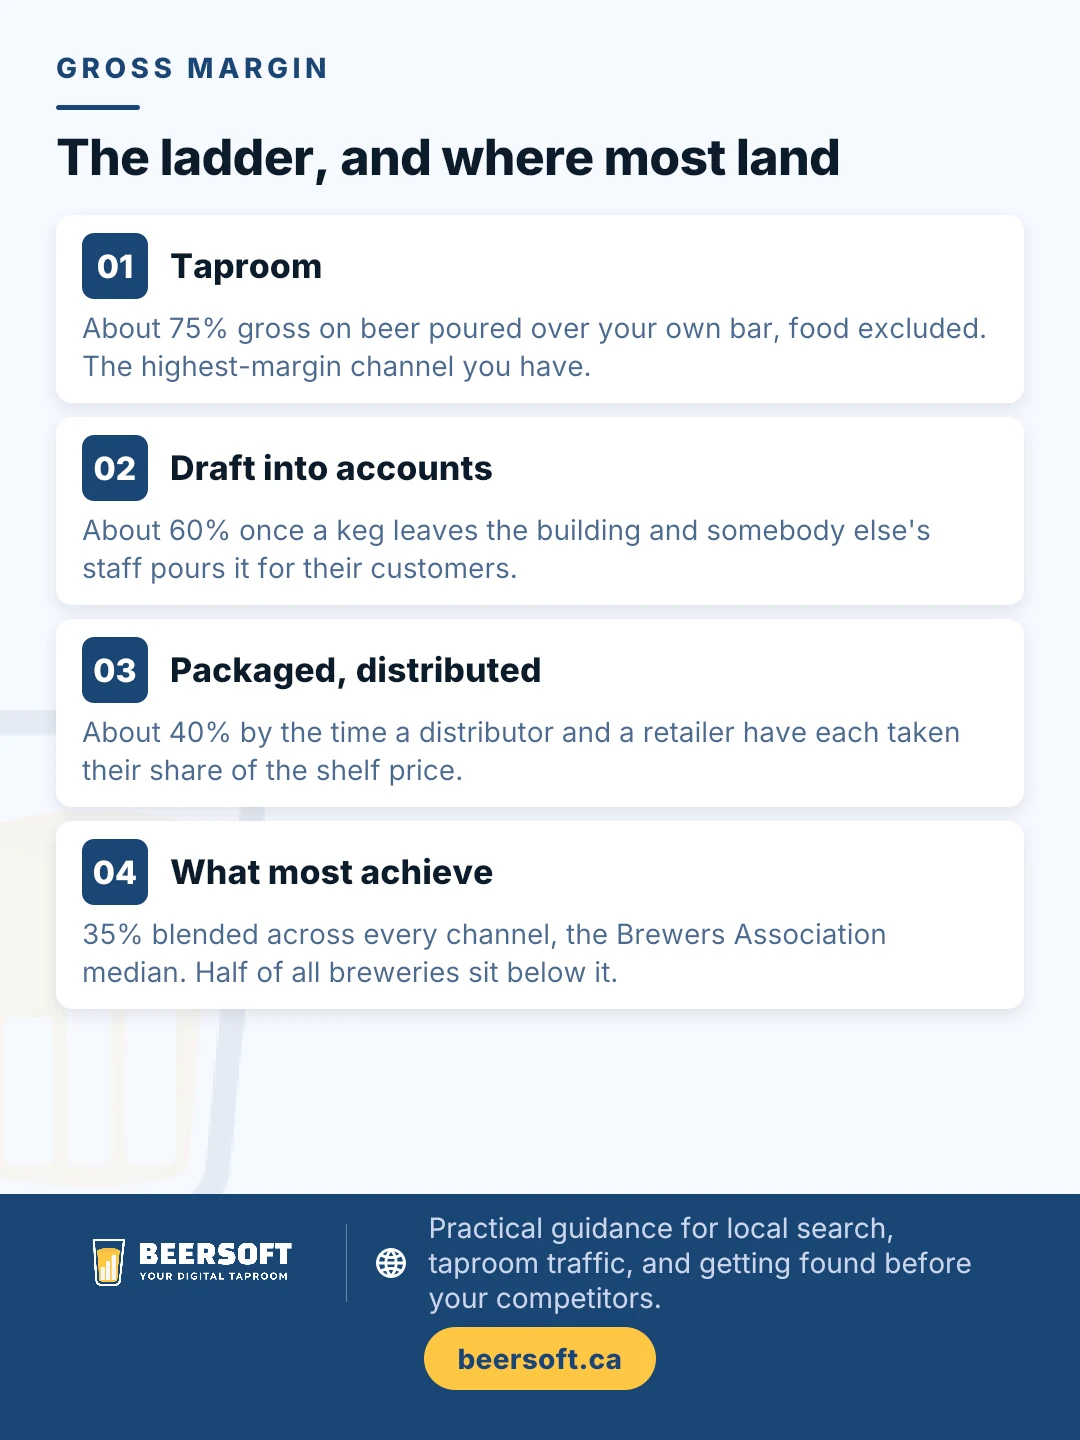
Because almost everything that happens to a barrel after it leaves the tank costs money, and the more hands it passes through the less of the retail price comes back to you. Published benchmarks from brewery accounting practice put the gross margin targets at roughly 75% on taproom sales, counting beer only and excluding food, around 60% on draft beer into accounts, and around 40% on packaged beer into distribution.
Read that as a ladder rather than three separate facts. The pint you pour yourself keeps nearly three quarters of its price. The same beer in a keg delivered to a bar keeps about six tenths. The same beer in a can moving through a distributor to a retailer keeps about four. Nothing about the liquid changed. What changed is how many businesses took a cut on the way.
This is also why the cost side can mislead. Operators tend to attack cost of goods, because that is the number brewing software puts in front of them. Cutting two percent off ingredient cost is worth real money, but it is worth the same two percent in every channel. Moving a point of volume from packaged to taproom moves the margin on that beer by something closer to thirty-five points.
The practical ceiling on that logic is demand, and it is a hard one. You cannot pour your way out of distribution if nobody walks in. Taproom capacity is finite, it is local, and it depends entirely on traffic you have to generate. Which is where this stops being an accounting question.
Key Takeaway: Before negotiating a cent off a can, work out what one more point of taproom volume is worth. In most cases it is the larger number by a wide margin.
What Should That Gap Do to a Marketing Budget?
It should change what you are willing to pay for a visit. If a pint poured on site returns roughly 75 cents on the dollar and the same beer through distribution returns roughly 40, then a dollar of marketing that produces a taproom visit is doing close to twice the work of a dollar that produces a shelf pickup. That ratio is the single most useful thing on this page.
It does not mean abandoning distribution, which does things taproom sales cannot: it buys reach, trial in markets you will never drive to, and the brand presence that makes the taproom worth visiting in the first place. It means the two are not interchangeable when you are deciding where the next thousand dollars goes, and most brewery budgets are built as though they are.
This is the question operators most often bring BeerSoft, usually phrased as whether the spend is working, when the more useful question is which channel it is working for. Where the beer earns its margin on site, local discovery and repeat visits earn their keep faster than brand awareness does, and a mug club or membership program compounds that advantage by making the highest-margin channel the habitual one.
How to split a budget across those channels in practice, with allocation ranges and the consumer behavior behind each, is covered in depth in our guide to craft beer consumer behavior in 2026. This post stops at the economics that should drive the split.
Key Takeaway: Value a taproom visit at roughly double a distribution sale of the same beer when you compare marketing options, then check whether your budget reflects that.
Why Is the Median So Far Below Those Benchmarks?
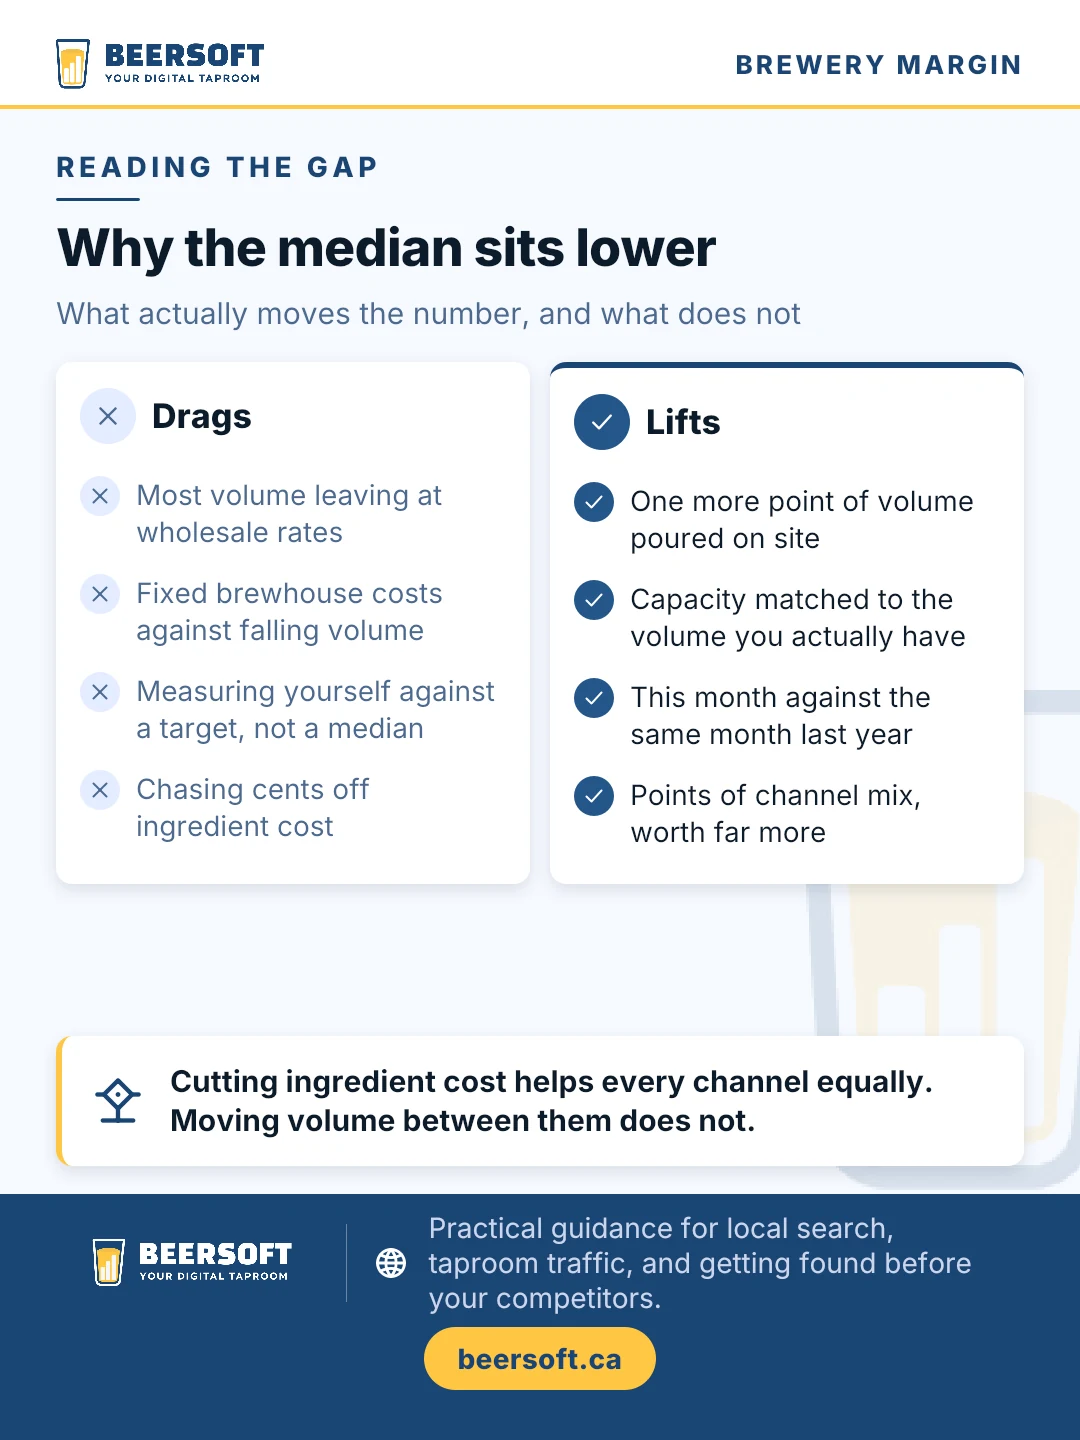
Because the benchmarks are targets and the median is a description, and the gap between them is itself the finding. A 35% median gross margin sits below even the 40% figure quoted for the lowest-margin channel, which on a first reading looks impossible.
Three things explain most of it, and operators should know which applies to them. The channel figures are gross margin targets for well-run operations, so a median that includes breweries having a bad year will sit below them by construction. The 35% figure describes beer production across all channels blended, and a brewery selling mostly packaged beer is anchored near the bottom of the ladder before anything goes wrong. And scale is unforgiving in brewing: fixed costs on a brewhouse do not shrink when volume does, so the same brewery can slide several margin points on a volume decline it did nothing to cause, which is precisely the environment of the last two years.
Key Takeaway: If your gross margin is near 35% and most of your beer goes out packaged, you are roughly where the data says you should be. That is information, not a verdict.
Which Numbers Should a Brewery Actually Track?
Fewer than most dashboards show, and the useful ones are mostly ratios rather than totals. Revenue is the number everyone watches and the one that tells you least, because it moves for reasons that have nothing to do with whether the business is working.
Blended revenue per barrel around $300 is generally treated as a good result, though it depends heavily on pricing mix, and a taproom-led brewery should expect to clear it comfortably while a distribution-led one may not. Inventory turnover of about four turns a year and days inventory on hand near 90 days are the standard brewing benchmarks, with smaller breweries often struggling to reach them. A debt-to-equity ratio around 1:1 is considered reasonable, and the direction of travel matters more than any single reading. And for anyone weighing whether the business justifies the capital in it, a brewery's return is fairly compared against a roughly 8% market yield, with outside investors expecting more.
Track those alongside the two margin figures and you can answer the question in the title for your own brewery rather than for the median one.
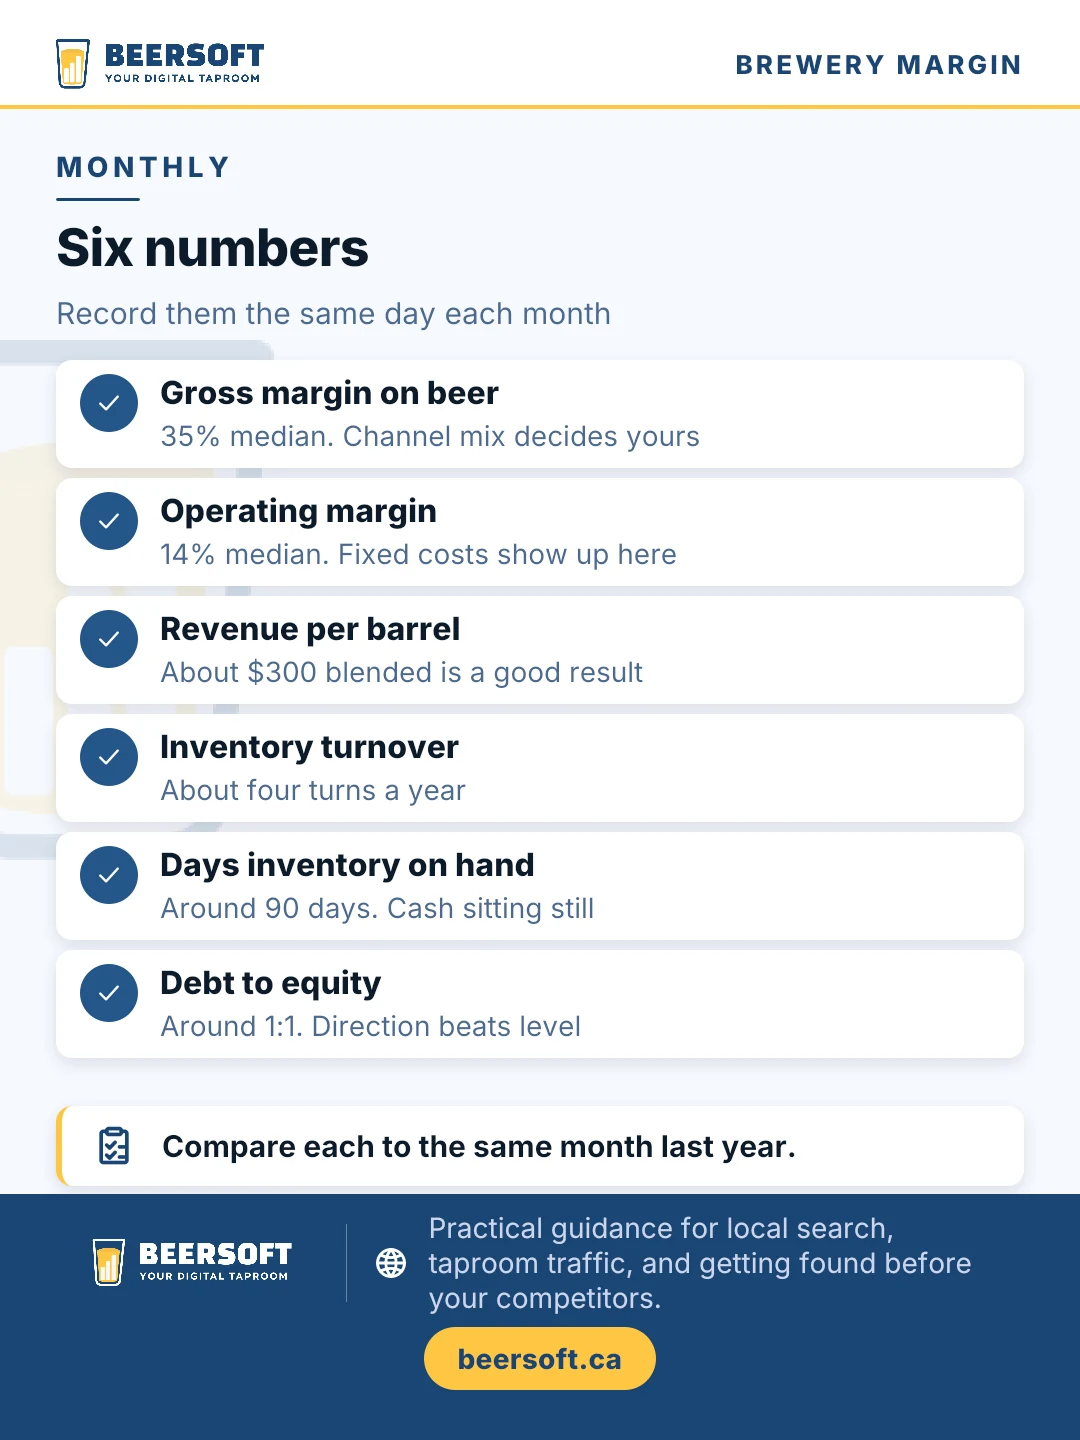
Two habits make those numbers useful rather than decorative. Record them on the same day each month, because a ratio compared against an irregular interval tells you very little. And compare each against the same month a year earlier rather than against the month before, because brewing is seasonal enough that month-on-month movement is mostly weather. A taproom-led brewery in February and the same brewery in July are different businesses on paper.
The second habit is harder and matters more: write down what you expect to see before you look. A benchmark consulted after you have seen your own number stops being a check and becomes a justification, and the figures in this article are easy to use that way. Thirty-five percent is a median, which means half of all breweries sit below it, and finding yourself there is not reassurance.
Key Takeaway: Pick the six numbers above, record them monthly, and compare each against itself a year ago. A ratio moving the wrong way for three months is a problem; a single reading is noise.
Frequently Asked Questions
What is a good profit margin for a brewery?
Brewers Association financial benchmarking of 2025 data puts the median gross profit margin on beer production at 35% and the median operating profit margin at 14%. Published channel targets for a well-run brewery are higher: around 75% gross on taproom beer sales, around 60% on draft into accounts, and around 40% on packaged beer into distribution. A brewery selling mostly packaged beer should expect to sit near the bottom of that range.
Are breweries profitable in 2026?
On the median, yes but narrowly. A 14% operating margin is a functioning business rather than a comfortable one. The context is a contracting market: 9,344 operating US breweries in June 2026 against 9,515 a year earlier, a net loss of 171, with craft volume down about 4% across the first half of the year. Brewpubs and taprooms contracted least, at about 1% and 2%, while microbreweries and regional breweries both fell about 3%.
Does a taproom make more money than distribution?
Per unit of beer, substantially. Published gross margin targets are roughly 75% for taproom sales against roughly 40% for packaged beer in distribution, because every business the beer passes through takes a share of the retail price. The limit is demand rather than margin: taproom capacity is local and finite, and the volume only exists if people come in. Distribution buys reach that taproom sales cannot.
How much revenue per barrel should a brewery make?
Around $300 per barrel is generally considered a good blended result, though it depends on pricing mix and channel blend. A taproom-led brewery should expect to clear it, while a distribution-led brewery may sit below it and still be run well. Treat it as a comparison against your own previous figures rather than against another brewery.
Why is my brewery's margin below the industry benchmark?
The most common reason is channel mix rather than anything wrong with the brewing. The published channel targets assume a well-run operation, and the blended median of 35% includes breweries having a difficult year. Fixed costs on a brewhouse also do not shrink with volume, so a brewery can lose several margin points on a volume decline it did not cause, which describes much of the last two years.
Conclusion: Ask Which Channel, Not Whether
The question in the title has an answer, and it is 35% gross and 14% operating on the median. The more useful answer is that the median is mostly a function of how a brewery sells rather than how it brews, and that the spread between channels is wide enough to decide a year on its own.
Which means the marketing question and the margin question are the same question asked twice. If a visit is worth close to double a shelf pickup, a budget that treats them as equivalent is quietly funding the wrong channel. Working out which channel a brewery's money is actually buying, and whether that matches where the margin is, is the first thing BeerSoft does on a digital marketing engagement. If you know your channel mix and want a second opinion on whether the spend matches it, get in touch.
Sources
- Brewers Association. Picking Apart Profitability. Reports median gross profit margin of 35% and median operating profit margin of 14%, from the Brewers Association Financial Benchmarking study of 2025 data.
- Brewers Association. Quick Take: Financial Benchmarking Survey Results. The benchmarking study itself, covering full-year 2025 data against the previous survey's 2023 data, run every two years and released to members in late summer 2026.
- GHJ. Craft Beer Metrics: The Financial Ratios and Key Performance Indicators to Know.
- Brewers Association. 2026 Midyear Report: Pressure Persists as Signs of Stability Emerge.
Stay Ahead - Subscribe Now!
You may also be interested

Why Are Breweries Closing in 2026? What Owners Can Learn
Closures fell in 2025. Openings fell more than twice as fast. Here is what the contraction data actually says, and the six numbers in your own brewery that say it first.

How Much Does It Cost to Start a Brewery?
What the paperwork really costs, what a brewhouse really costs, and why the parts nobody publishes prices for are the ones that decide the number.

Is Your Brewery Website Invisible to ChatGPT? Signs It's Not AI-Ready
A retrieval-first diagnostic: which OpenAI bot you are blocking, whether your CDN decided it for you, and which of the usual AI-readiness warnings actually hold up.
Can a Brewery Deliver or Ship Beer? What the Rules Allow
Delivery and shipping are different things and the law treats them differently. Where a brewery may ship, what a compliant shipment requires, why the post office is never the answer, and what the nine-province Canadian agreement does and does not do yet.

How to Rank a Brewery on Google Maps
Google names three factors behind every map pack result. Two of them a brewery can move, one it never can, and the highest-leverage setting on the whole profile takes about two minutes to change.


Google Ads for Breweries: When Paid Search Beats Paid Social
A practical guide to paid search for taproom breweries: real category benchmarks, the alcohol policy rules that decide which campaign types you can run, and the intent split that tells you when to spend on Google instead of Meta.

Beer Can Design That Sells: Shelf Impact for Craft Packaging
What a can is really competing against, the one thing that should stay constant across a range, how the decoration method sets your minimum order, and what to hand a designer

What Actually Breaks on a Brewery Website, and What Maintenance Covers
The honest inventory of what decays on a brewery website, why plugins carry the risk on WordPress, what breaks on hosted builders instead, what a plan costs, and what you can do yourself

Brewery Website Migration: How to Move Platforms Without Losing Your Rankings
When a brewery actually needs to change platforms, what a migration genuinely puts at risk, the URL map that has to exist before anything moves, and the checks that close it out

Brewery Email Marketing: The Four Sends That Earn Their Keep
Why the newsletter is the weakest thing you can do with a brewery list, the four sends that replace it, where the names actually come from, and the two numbers worth reporting

Should Your Taproom Run a Chatbot?
What a taproom chatbot would actually be asked, what the 2026 data says about how chatbots perform, why the tap list is the worst thing to put in one, the narrow cases where it does pay, and what to fix instead
Beer Photography for Small Breweries: What to Shoot and When
What a small brewery actually needs photographs of, why a beer shot takes longer than it looks, what a half-day and a full day cost and deliver, which images have a window that closes, and how to write a brief

What a Brewery Website Costs, and What Drives the Number
Why quotes for the same brewery website vary by three times, what makes a taproom site structurally different from a brochure site, which decisions actually move the price, what you pay after launch, and how to compare quotes fairly

Choosing a Taproom POS: What to Ask Before You Sign
What a brewery POS has to do that a restaurant POS does not, why the processing rate matters more than the subscription, what is actually in the contract, who owns your data when you leave, and the questions to ask before signing

Which Taproom Workflows to Automate First
Which taproom workflows actually repeat often enough to justify automating, why federal compliance reporting is the highest-value target, what to connect after that, what to leave alone, and the order to do it in

Beer Label Design: What the Regulator Requires Before the Designer Starts
What the TTB requires on every beer label, how long approval actually takes in 2026, which rules constrain the artwork itself, what really delays a launch, and the brief a designer needs before starting
How to Start a Brewery: The Digital Foundations to Get Right First
What the federal and state approval timeline actually looks like in 2026, why your brewery name is a digital decision before it is a branding one, what to build during the approval window, and what has to be live before your first pour

The Three-Tier System, Explained for Brewery Marketers
Why the three-tier system exists, which marketing activities it forbids outright, exactly what a brewery may legally give a retailer and up to what value, why beer is treated differently from wine and spirits, and which channel you fully control
What Is a Mug Club? How Taprooms Build Recurring Revenue from Members
What a mug club is, how it differs from a points program, what the membership fee actually buys a taproom, the liquor-law rules that decide how you structure it, and how to publish the club so it can be found

ABV, IBU and SRM Explained: The Numbers on Your Tap List
What ABV, IBU and SRM actually measure, why the IBU number misleads drinkers, what the TTB requires you to print, and how to publish the specs so search engines and AI assistants can read them

Craft Beer Consumer Behavior in 2026: What the Data Means for Your Marketing Budget
How the major craft beer consumer behavior shifts of 2024 to 2026 translate into practical marketing budget decisions for taproom breweries, brewpubs, and microbreweries
Brewery Tourism Marketing: How to Attract Out-of-Town Visitors and Drive Weekend Traffic
How taproom breweries can attract out-of-town visitors, rank in tourism discovery platforms, and build the partnerships that drive consistent weekend traffic from the tourist segment in 2026
Brewery Loyalty Programs: Do Points and Perks Actually Drive Repeat Visits?
An evidence-based guide to brewery loyalty program mechanics, platform options, and ROI measurement for taproom operators considering whether and how to launch a customer loyalty program in 2026

Brewery Events as a Revenue Engine: How to Promote, Price, and Measure
How taproom breweries and brewpubs can promote, price, and measure events as a primary revenue engine rather than a secondary marketing activity in 2026
Brewery Merchandise and Secondary Revenue: How to Market Beyond the Pint
How taproom breweries and brewpubs can market merchandise, crowler programs, and beer club memberships as both a revenue diversification tool and a customer loyalty driver in 2026
12 Things Killing Your Local Search Rankings Right Now
A 12-point self-audit guide for brewery operators to identify and fix the website issues most commonly responsible for poor local search rankings and limited AI search visibility in 2026

Marketing Non-Alcoholic Beer: How Craft Breweries Can Capture the Sober Curious Consumer
How craft breweries can market non-alcoholic beer lines to sober-curious consumers, health-conscious drinkers, and younger demographics to capture the fastest-growing segment in the craft beer market in 2026
Brewpub Marketing Strategy: How to Fill Both the Bar and the Dining Room
How brewpubs can use digital marketing to fill both the dining room and the bar by marketing the food and beer experience as a unified destination rather than two separate offerings
Microbrewery Marketing in a Shrinking Distribution Market: What to Do When Shelf Space Disappears
How microbreweries facing shrinking distributor interest and tightening shelf space can use digital marketing to differentiate their brand and pivot toward direct-to-consumer channels in 2026

Brewery Social Media Strategy for 2026: Instagram, Facebook, and When to Bother with TikTok
A platform-by-platform social media strategy for taproom breweries and brewpubs in 2026, covering Instagram, Facebook, and TikTok with content mix ratios and posting cadence

Brewery Content Marketing in 2026: What to Publish, When, and Why It Works
What to publish, when to publish it, and why a structured content marketing program is the highest-ROI long-term investment available to brewery operators in 2026
Meta Ads for Breweries: A Geo-Targeted Playbook for Taprooms and Brewpubs
A geo-targeted Meta advertising playbook for taproom breweries and brewpubs covering campaign structure, audience targeting, ad formats, and budget guidance for 2026

Multi-Location Brewery SEO: How Regional Craft Breweries Rank in Every Market
How regional craft breweries operating multiple taprooms can build an SEO architecture that ranks independently in every local market without cannibalizing results.
Brewery Review Marketing: How to Turn Guest Feedback into Local Search Fuel
Google reviews are the number two local ranking factor for breweries. Learn how to generate, respond to, and optimize reviews for local search and AI search visibility.

Google Business Profile for Breweries: The Complete 2026 Optimization Guide
How to set up, optimize, and maintain your brewery's Google Business Profile to dominate local search and drive foot traffic in 2026.

How to Make Your Brewery Visible in AI Search: A GEO Guide for Craft Breweries
How craft breweries can use Generative Engine Optimization (GEO) to stay visible in AI-powered search results in 2026
